Psychometrics and Data Science with R and Python

Lexicon-Based Sentiment Analysis Using R
In this post, we will uncover the power of lexicon-based sentiment analysis using R. I demonstrate how to harness the capabilities of lexicons like NRC and Bing to decipher the emotional pulse of your text data. With practical examples, you'll gain the skills to analyze sentiment scores and extract valuable insights from your textual data sets. (12 min read)

Introduction to Psychometric Network Analysis
Psychometric network analysis (PNA), also known as network psychometrics, has emerged as a new framework to analyze the relationships among observed variables to better understand the underlying structure of psychological phenomena. Psychometric network models are particularly useful when dealing with complex and multidimensional data. In this post, I provide a brief introduction to psychometric network models, particularly Gaussian graphical models (GGMs), and demonstrate how to estimate them using R. (7 min read)

Text Vectorization Using Python: Word2Vec
In the first two part of this series, we demonstrated how to convert text into numerical representation (i.e., text vectorization) using the term-document matrix and term frequency-inverse document frequency (TF-IDF) approaches. In the last part of the series, we focus on a more advanced approach, Word2Vec, that can capture the meaning and association of words within a text. First, we will briefly explain how Word2Vec works and then demonstrate how to use Word2Vec in Python. (7 min read)

Text Vectorization Using Python: TF-IDF
In the first part of this text vectorization series, we demonstrated how to transform textual data into a term-document matrix. Although this approach is fairly easy to use, it fails to consider the impact of words occuring frequently across the documents. In the second part of the series, we will focus on term frequency-inverse document frequency (TF-IDF) that can reduce the weight of common words while emphasizing unique words that are more important for each document. First, we will explain how TF-IDF can adjust the weights of the words based on their frequency in the documents and then demonstrate the use of TF-IDF in Python. (9 min read)
Text Vectorization Using Python: Term-Document Matrix
Text vectorization is an important step in preprocessing and preparing textual data for advanced analyses of text mining and natural language processing (NLP). With text vectorization, raw text can be transformed into a numerical representation. In this three-part series, we will demonstrate different text vectorization techniques using Python. The first part focuses on the term-document matrix. (8 min read)

Visualizing Machine Learning Models
Data visualization plays an important role when evaluating the performance of machine learning models. In this post, we demonstrate how to use the **DALEX** package for visualizing machine learning models effectively. Visualizations with **DALEX** can facilitate the comparison of machine learning models and help researchers understand which model works better and why. (10 min read)

5 Ways to Effectively Visualize Survey Data
When presented visually, survey results become much more interesting than some numbers squeezed into a boring table. Data visualizations can help your audience view and understand key insights in the results. There are many data visualization tools to present survey results visually, including bar charts, pie charts, and line charts. In this post, I demonstrate 5 alternative ways to visualize survey results. (13 min read)

Building a Computerized Adaptive Version of Psychological Scales
Computerized adaptive testing (CAT) is a sophisticated methodology to create measurement instruments that are highly accurate and efficient. In this post, I explain how to evaluate the feasibility of creating a computerized adaptive version of a psychological instrument. (12 min read)

A Polytomous Scoring Approach Based on Item Response Time
In this post, we introduce a polytomous scoring approach based on the optimal use of item response time. This approach provides an easy and practical way to deal with not-reached items in low-stakes assessments. First, we describe how the polytomous scoring approach works and then demonstrate how to implement this approach using R. (12 min read)

How to Shorten a Measurement Instrument Automatically (Part II)
Do you think there are too many questions on your survey? Are you worried that participants may get tired of responding to the questions in the middle of the survey? In this two-part series, I demonstrate how to shorten measurement instruments such as surveys automatically in R. The second part focuses on the use of two optimization algorithms (genetic algorithm and ant colony optimization) for reducing the number of questions in surveys and similar instruments. (13 min read)

How to Shorten a Measurement Instrument Automatically (Part I)
Reducing the number of items in an existing measurement instrument (e.g., tests, surveys, questionnaires) is almost as tedious as creating a new instrument. Going through all of the items one by one and choosing the appropriate ones based on personal judgment could be highly laborious and inefficient. In this two-part series, I will demonstrate how to shorten a measurement instrument automatically in R. The first part focuses on the use of automated test assembly and recursive feature elimination for the automatic selection of items. (9 min read)
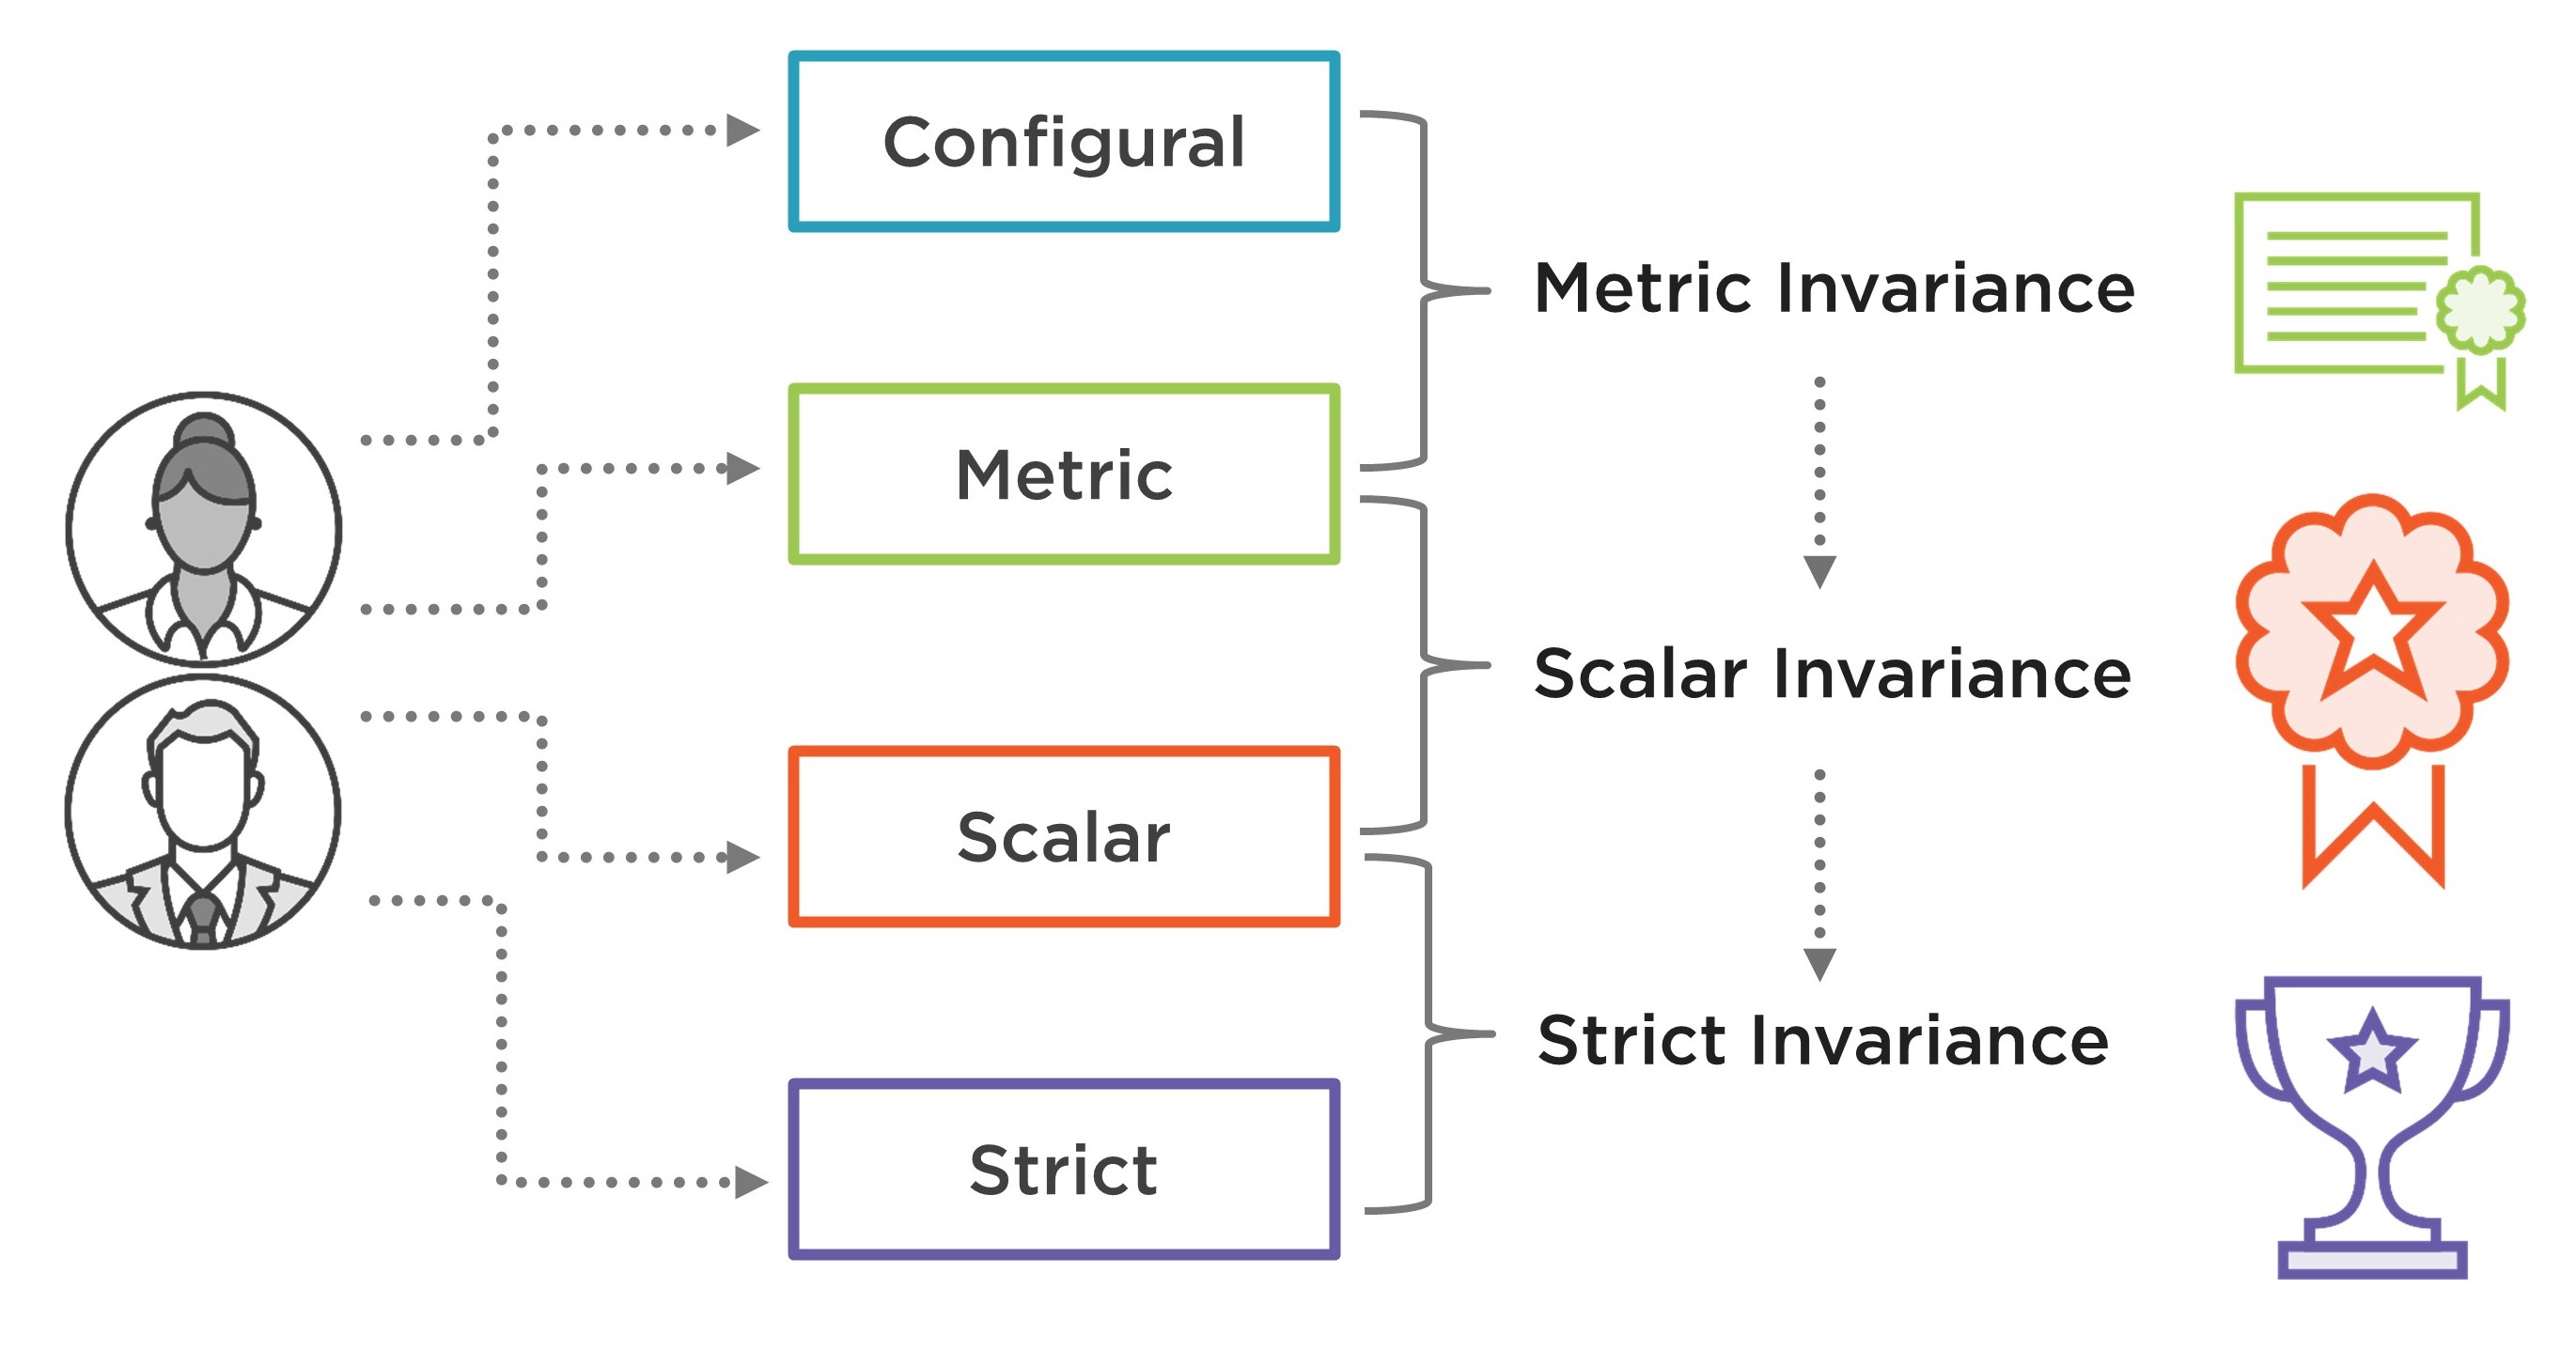
Testing for Measurement Invariance in R
Researchers conduct measurement invariance analysis to ensure that the interpretations of latent construct(s) being measured with their measurement instruments (e.g., scales, surveys, and questionnaires) are valid across subgroups of a target population or multiple time points. In this post, I demonstrate how to test for measurement invariance (i.e., configural, metric, scalar, and strict invariance) of an instrument using R. (11 min read)
Explanatory IRT Models in R
Explanatory item response modeling (EIRM) is a flexible framework that allows researchers to model both person and item characteristics as predictors together. In this post, I demonstrate how to use the `eirm` package to estimate explanatory IRT models in R. (4 min read)